
High correlation between Excess Deaths reported by Statistics Canada and Booster Doses administration is observed
The new feature of OpenCanada.info Tracker allows one to visualize the number of weekly administered vaccine doses - by dose type. Will it help to investigate the increase of deaths in January 2022?
Introduction:
The Open Canada Vaccination and Vital Statistics Tracker at OpenCanada.info visualizes vital and health-related statistics published by federal and provincial governments of Canada. Such statistics is made publicly available, however is often published in such a way that makes it difficult to use by general public. This interactive Tracker is built to address this gap.
A particular need for the development of this App came from the observation published at the Statistics Canada’s excess mortality dashboard that there have been excess deaths observed among young Canadians following the commencement of vaccination of young population in Canada:

The fact that such an important observation has not been made expediently and widely known to general public by the Canadian official media made this observation even more worrisome.
It is hoped that this App will help to break the silence and facilitate the much needed open discussion and investigation into why there are more deaths among Canadians after vaccination than before vaccination, in particular, among young and taking into account that Covid-related deaths constitute only a fraction of the observed excess deaths.
This App is built by a team of responsible Canadian citizen in support of National Citizen’s Inquiry (NCI).
Using the App
Weekly Deaths counts:
Go to the Open Canada Vaccination and Vital Statistics Tracker at OpenCanada.info portal, uncheck ‘Simplified layout’, choose multiple Provinces, different Age groups, and observe the following statistics of Deaths at the end of year 2021 beginning of year 2023 in the upper window of the App.
Note the following:
The vertical lines indicate the range between November 1, 2021 and March 1, 2022, which is the period when Statistics Canada has observed the increase of deaths, especially in Western provinces and among young Canadians.
Blue lines shows the increase over the five-year average for the same week before pandemic (2015-2019).
In this particular visualization, data is visualized using four-Week Simple Moving Average (4W SMA). For more robust comparisons, could be used 13W SMA, 26W SMA or 52W SMA can be used.
Note that Statistics Canada does not have age group corresponding to children. Instead, it provides a rather large group from 0 to 44.
Observed for all ages and older groups:

Observed for younger groups:

When zooming on the “youngest” group, one can observe excess deaths (blue lines above zero black line) among young in all provinces except Quebec.

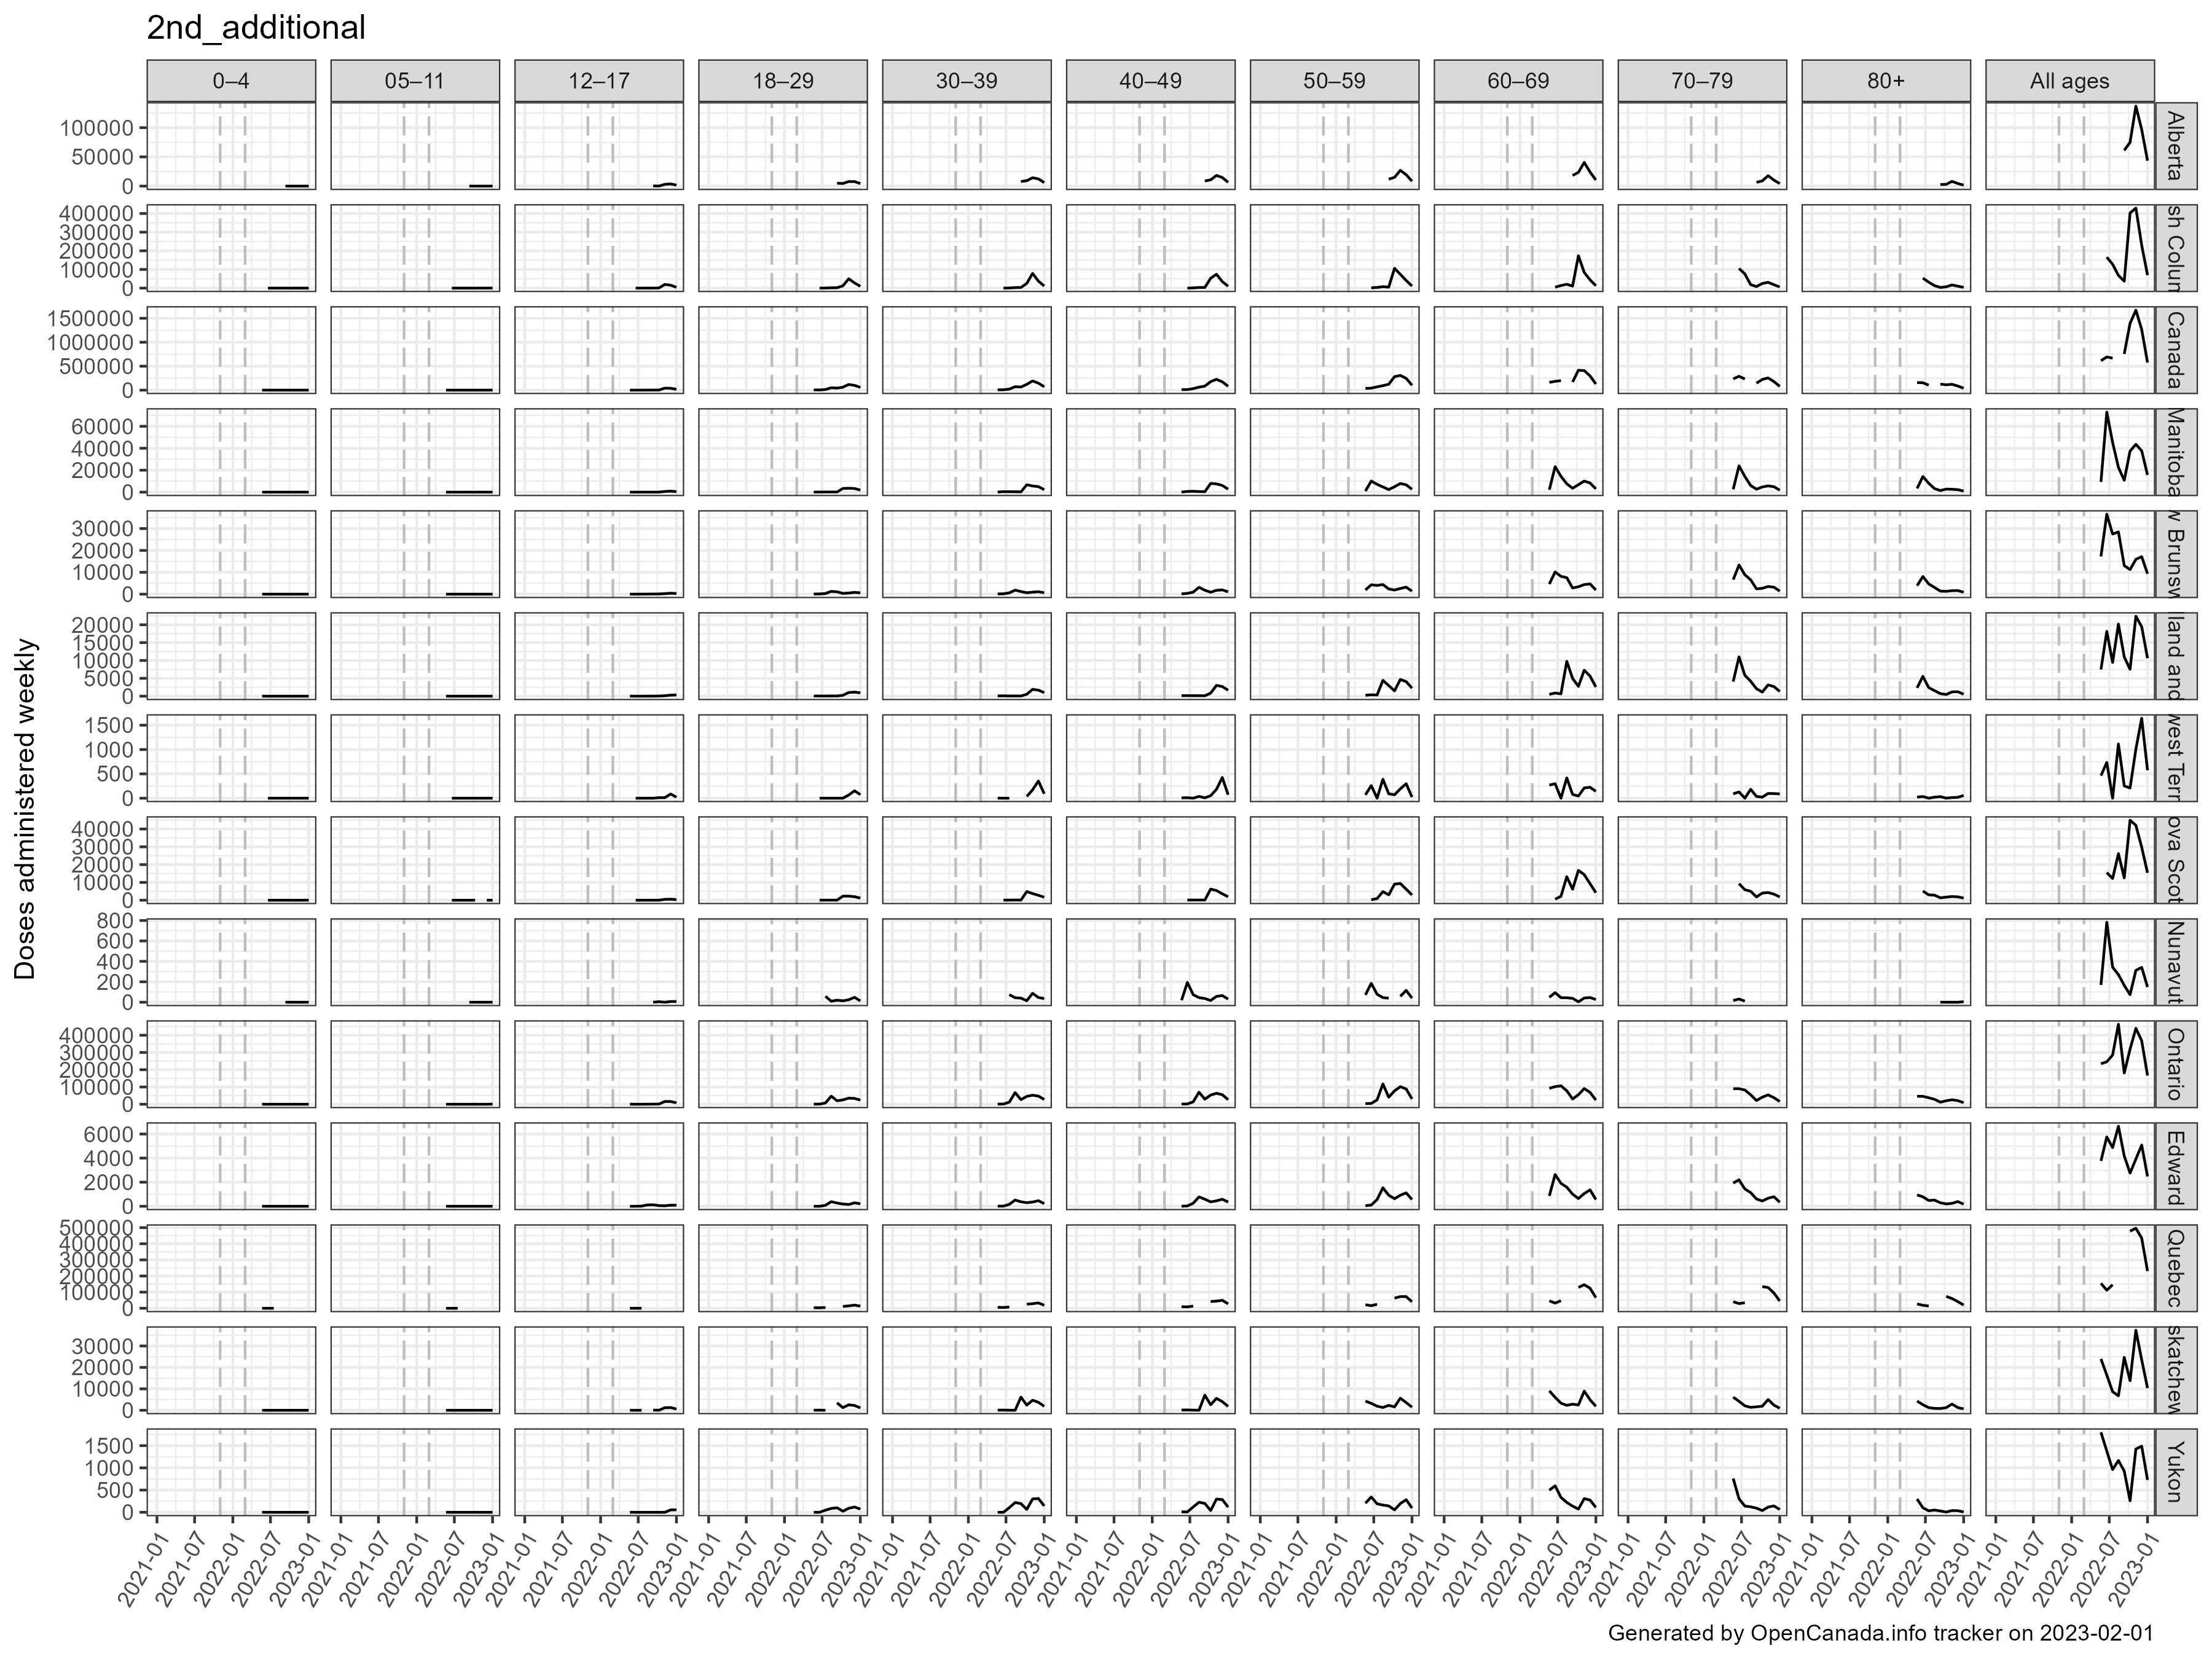
Weekly number of administered doses:
Let us examine now the vaccination information. The following images are shown in the lower window of the app.
Note the following:
Note that vertical lines show the same period as shown in the weekly deaths count images above.
PHAC reports these statistics as vaccination rates, i.e., totals for each vaccination status (dose number) : total number of people with at least one dose, total number of fully vaccinated, with additional dose and with second additional dose. Hence in order to obtain weekly number of administered doses for each type of dose, the vaccination rates data reported into two consecutive reports are subtracted from one another. This allows one to observe the periods when the largest number of doses were administered for each dose: for first dose, for second dose (fully vaccinated), for third dose (additional dose), and for fourth dose (second additional dose).


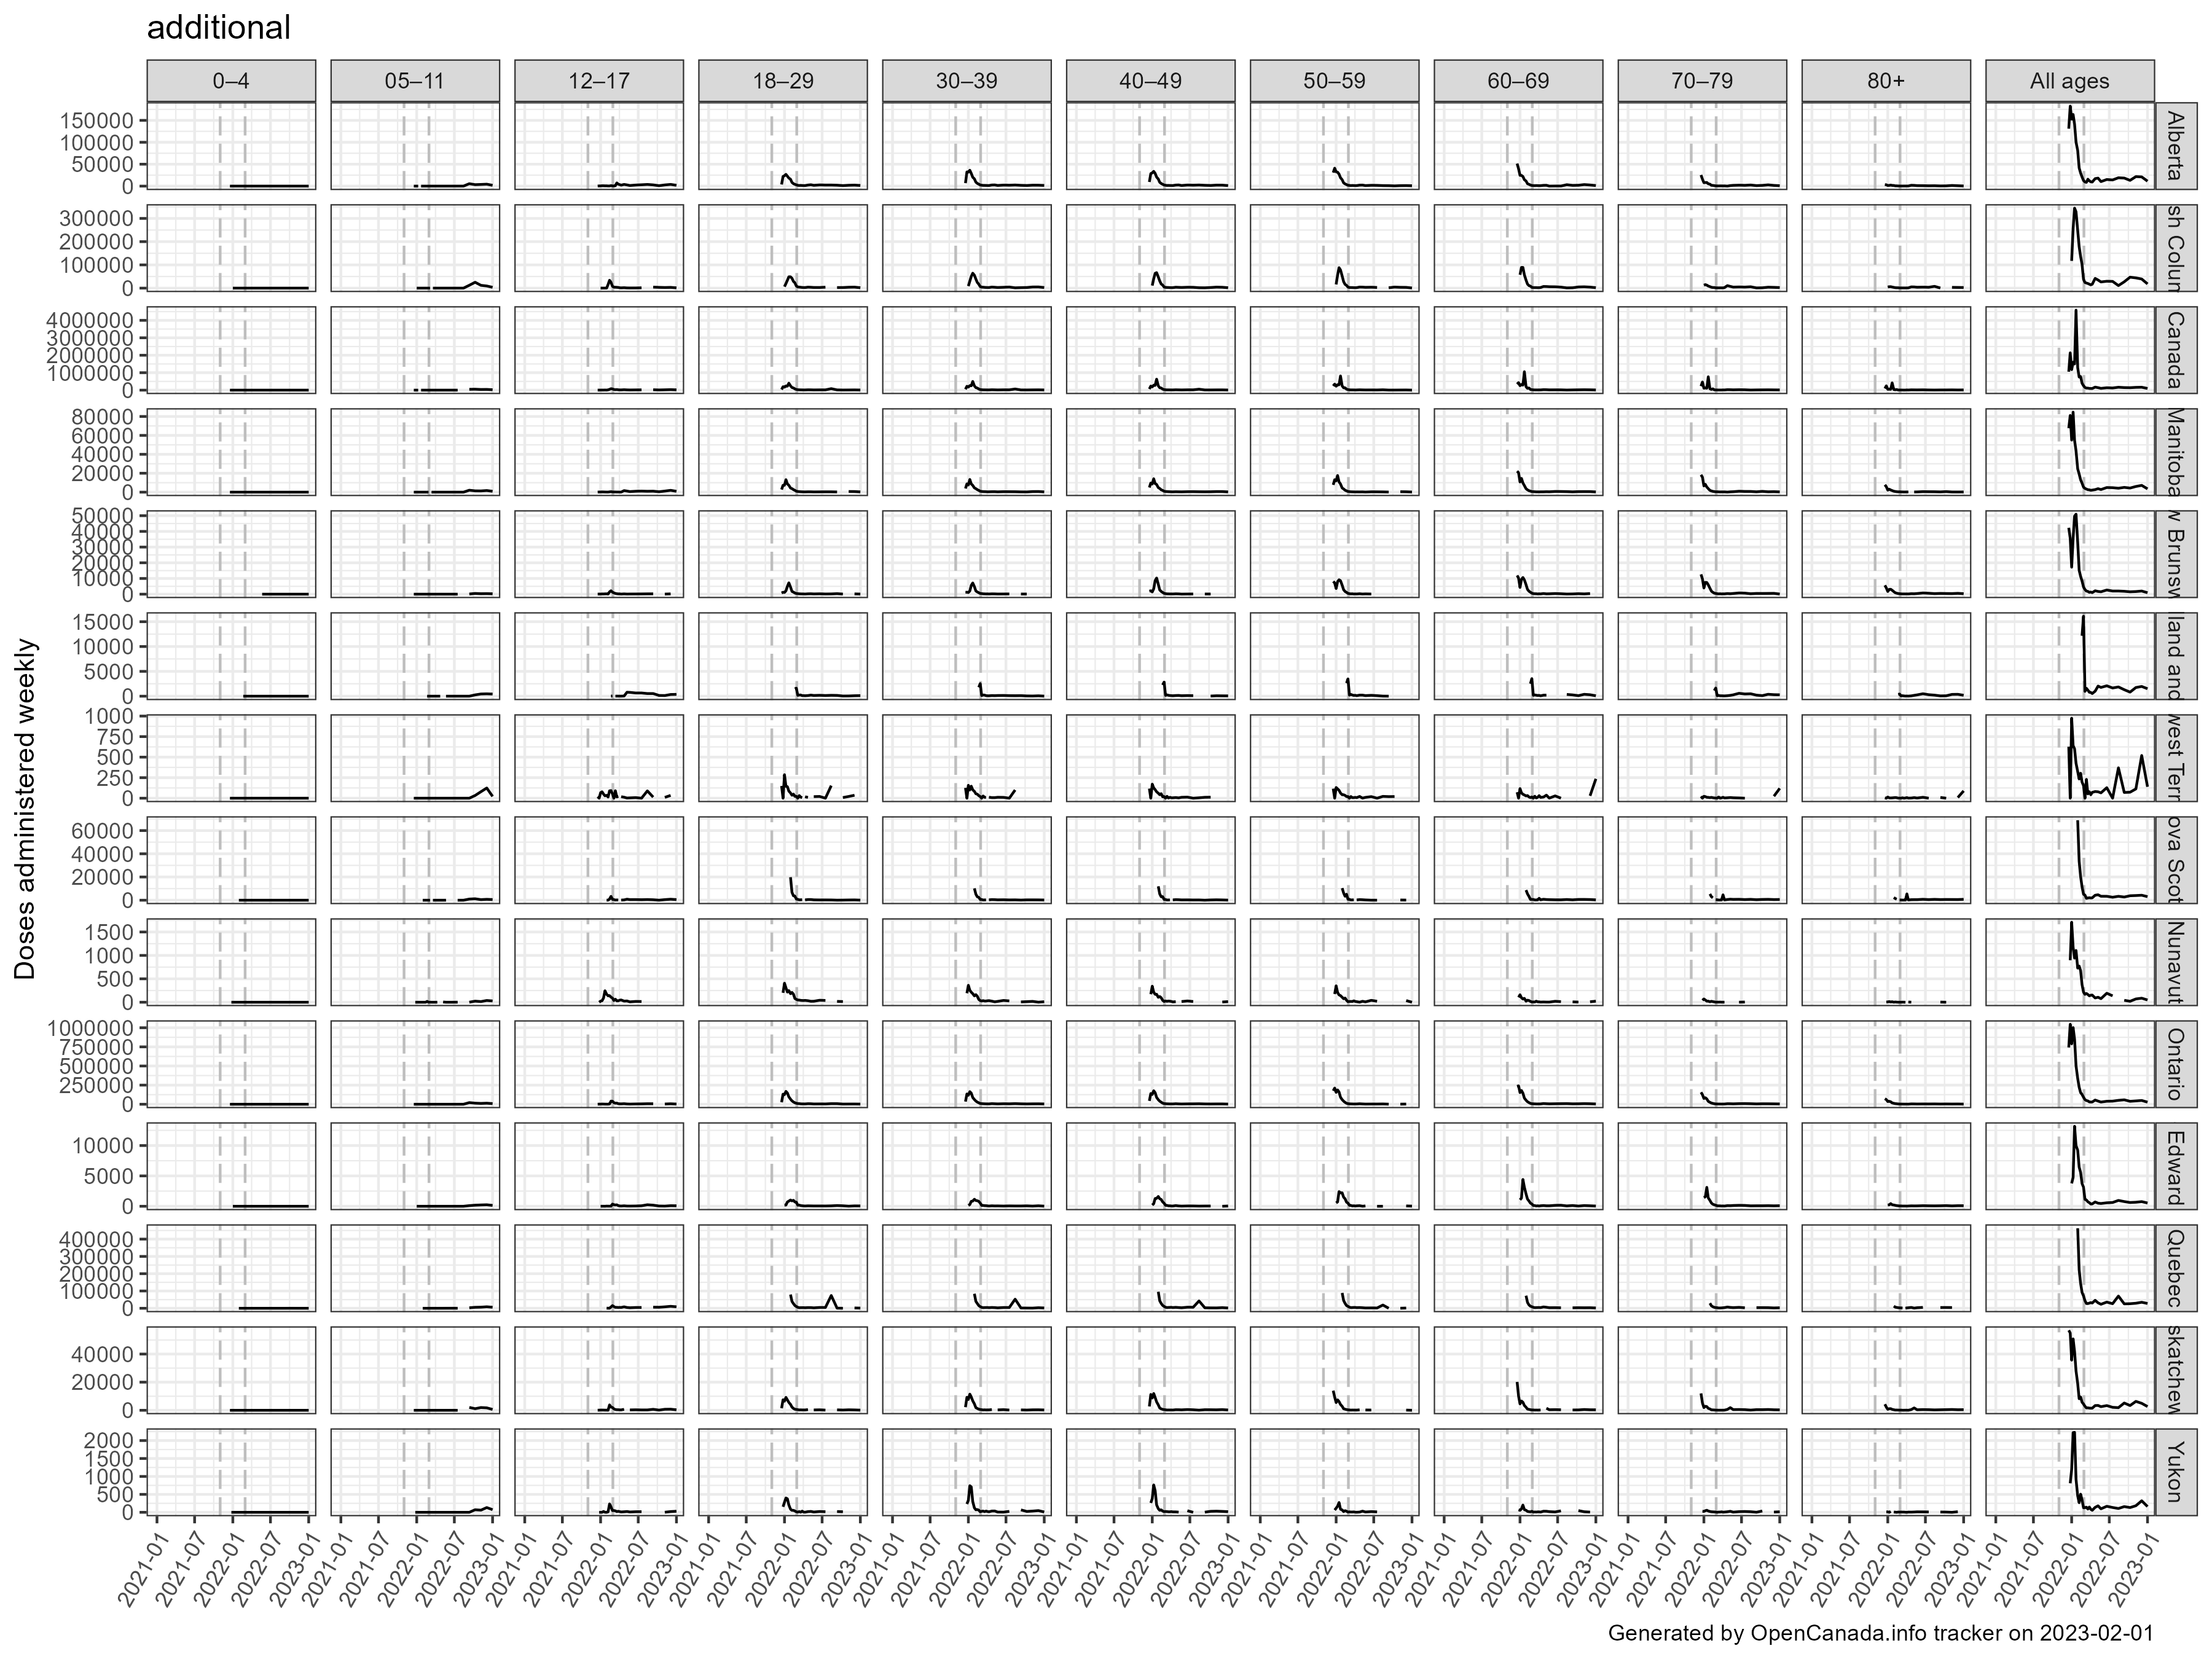
Observation
The spike observed in the number of weekly administered “additional” doses (Third image) practically coincides or immediately precedes the spike observed in the number of excess deaths.
One may argue this coincidence shows “correlation” and not “causation”. However, one needs to be reminded that we deal with substantially very large numbers - hundreds of young, and thousands of all ages excess deaths recorded every week, over a period of several weeks. Therefore, the effect of large numbers (which is used in all crowd-sourcing technologies) needs to be taken in account, leading to the following conclusion.
It is more probable than not that extra excess deaths that have been observed since the December 2021 are in fact related to the administration of the additional (booster) vaccination doses.
The other possibility that the observed excess deaths are related to COVID is rejected based on the fact that there were very few COVID deaths recorded during that period, in particular in the “young” age group - less than 5 % of the observed excess deaths. The OpenCanada.info Tracker will soon be updated to show this additional piece of information too.
Questions/comments: opencanada-info@protonmail.com
Follow us on YouTube (@OpenCanada-info) and Twitter (@OpenCanada_info)
Thank you thank you for allowing us to walk through the gate you're opening