
UK released All-Cause Mortality Data by Vaccination Status. Lets compare those to Canadian data.
Updates from partners and from OpenCanada.info Tracker App.
News from UK:
This week, ONS in UK has updated their ‘Deaths by vaccination status” dataset (full name: "Age-standardised mortality rates for deaths involving coronavirus (COVID-19), non-COVID-19 deaths and all deaths by vaccination status, broken down by age group."), which immediately captured attention of many data lovers and truth seekers around the globe. This includes OpenCanada.info Tracker partners who developed USMortality.com and mortality.watch apps. Have a look!
Interestingly, they have immediately found data quality issues with this new update, which they have already reported to ONS, and ONS have already acknowledged and corrected one of the six identified problems…
Start reading from here:

followed by this one:
Another comprehensive analysis of this new ONS data is presented in this Substack, where they also discuss it with Dr. John Campbell:

And then this substack is further exposing the lack of data and scientific integrity in this newly published UK data:

As does this one:

How this related to OpenCanada.info?
We - at OpenCanada.info - are also very interested in this UK dataset, and may also add it to Interactive Deaths Tracker App. As the starting point, here is the technical information about this dataset. The direct link to xls is here. The google sheet for this data has been also created here.
cUK <- COpenData$new(
  source = "UK",
  page  = "https://www.ons.gov.uk/peoplepopulationandcommunity/birthsdeathsandmarriages/deaths/bulletins/deathsinvolvingcovid19byvaccinationstatusengland/latest",
  title = "Age-standardised mortality rates for deaths involving coronavirus (COVID-19), non-COVID-19 deaths and all deaths by vaccination status, broken down by age group.",
  title.short = "Deaths, including with COVID-19, by vaccination status and age",
  xls = "https://www.ons.gov.uk/file?uri=/peoplepopulationandcommunity/birthsdeathsandmarriages/deaths/datasets/deathsbyvaccinationstatusengland/deathsoccurringbetween1april2021and31december2022/referencetablefeb213.xlsx",
  gsheet = "https://docs.google.com/spreadsheets/d/1Cmmxk2dRR9-zD241B_wl7bv9CxmTm0crVLJyS8tUtaE/edit?usp=sharing",
  comment = "Deaths occurring between 1 April 2021 and 31 December 2022 edition of this dataset. Data for 1 January 2021 available on the same site. Contact details for this dataset: health.data@ons.gov.uk",
  dateLatestRelease = "21 February 2023",
  frequency = "Monthly",
  updated = "Monthly till June 2022. No releases after that until February 2023"
)
In meanwhile, here in Canada …
In meanwhile, here in Canada, Statistics Canada have also updated their Deaths by Causes and Deaths by Age statistics (on 9 February 2023), which you can view on the OpenCanada.info tracker. Direct link to the Tab is here, and the image is shown below.
Last record in data now is 2022-12-03 for most provinces. ON and SK are two months behind. (When you run the app, select “Live” to view the latest data releases)
Note that Canada does not publish Deaths by Vaccination Status, and it had not published Covid Deaths by Vaccination Status since September 2022.
However, what it does publish is also very informative. - Their data show the large number of Excess Deaths in all provinces, comparing to prepandemic five-year historic average (red line over black line in the image). They also show that Covid Deaths count just a minor fraction of Excess Deaths (less than 20% in most provinces). And they also show the continuing large number of deaths for which the cause is not Reported (Information Unavailable). All of these are alarming observations, aren’t they?

OpenCanada.info Tracker update:
The work continues on improving the usability and speed of the OpenCanada.info Tracker App. Check it out - Hope you’ll like it. Below is the latest layout.
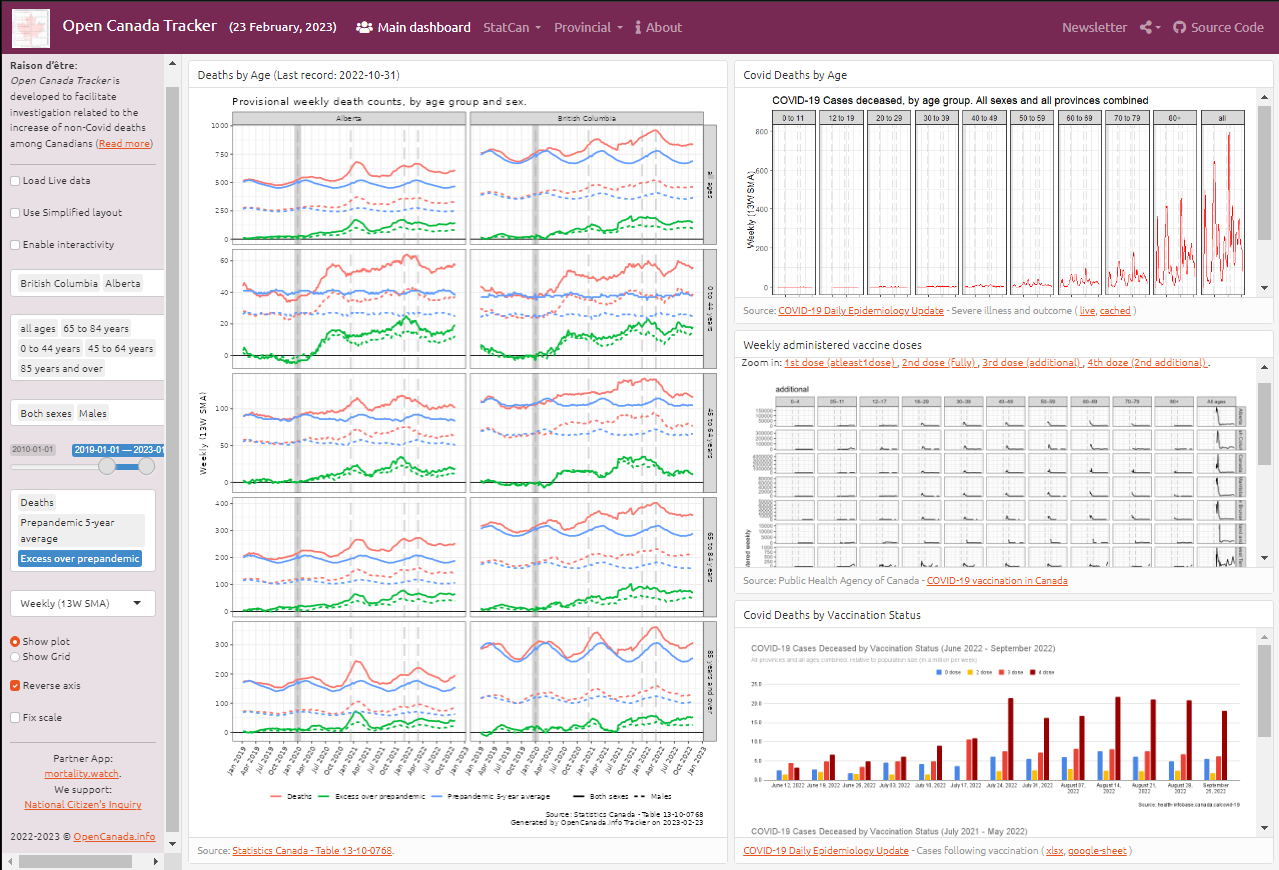
Note that the App is live, meaning that , when you launch it, it loads data directly from several Gov’t of Canada sources (StatCan and PHAC). This is why it may take for upto a minute sometimes to load all data. This is also why now, by default, the App loads cached data, which should improve the loading time.
You’ll also note **Raison d'être** has been added on the front page (*Open Canada Tracker* is developed to facilitate investigation related to the increase of non-Covid deaths among Canadians).
Also “Use Simplified Layout” button was added, which you need to uncheck to be able to display more that one graph in the images.
Please spent some time familiarizing yourself with this Web. This is probably the most comprehensive visualization you will ever find showing you the data related the large increase of non-covid of deaths observed in Canada - especially among males and in Eastern provinces, as seen in the image below.

One image is worth a thousands of words, isn’t?
And also a thousands of vanished lives… Vanished from what, if not from Covid??
How Canada explains these deaths?
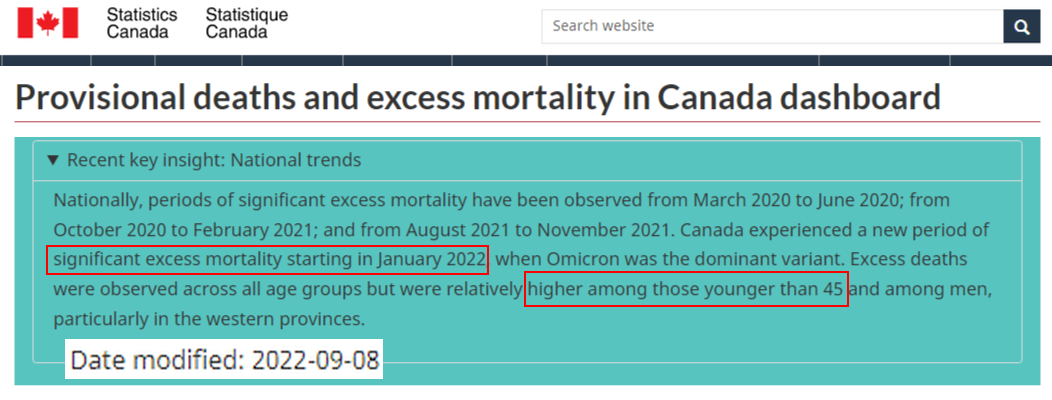
Incidentally, this month StatCan has also updated the Recent key insights on its Provisional deaths and excess mortality in Canada dashboard. This is what they wrote there now. Compare to what they wrote back in September 2022 (shown in image below).
Recent key insight: Changing impacts on age groups
Since the onset of the pandemic, older Canadians have experienced a disproportionate share of both excess deaths and COVID‑19-caused deaths. From March 2020 to early March 2021, about one third of the excess mortality and just over half of the deaths caused by COVID‑19 observed in Canada involved individuals older than 84. However, those younger than 65 years have accounted for just over 10% of the deaths attributed to COVID‑19 but 30% of the excess deaths, suggesting that other factors are driving excess mortality among younger Canadians. While COVID‑19 has been a main driver of excess deaths overall, other factors are driving excess mortality as well, particularly among younger Canadians.
Deaths attributed to unintentional (accidental) poisonings and exposure to noxious substances, including overdoses from prescription, over-the-counter and illicit substances, have risen since the beginning of the pandemic. Younger age groups made up a disproportionate number of deaths from overdoses. Alcohol-induced mortality also increased significantly throughout the pandemic. The effects of this increase were felt most among those aged younger than 65 years.
Recent key insight: National trends
Prior to the emergence of the Omicron variant of COVID‑19, four significant periods of excess mortality were observed nationally since the start of the pandemic. From March 2020 to June 2020, followed by a longer period of excess deaths from September 2020 to February 2021. There was a shorter period experienced in May 2021, and another coinciding with the emergence of the Delta variant, from July 2021 to December 2021. While in general, these four periods have coincided with higher numbers of deaths due directly to COVID‑19, excess mortality could be affected because of various other factors, including delayed medical procedures, increased harms related to substance use, or changes in the prevalence of other diseases and medical conditions. For example, in the early summer of 2021, Alberta and British Columbia experienced a heat dome which coincided with more than 3,500 deaths in the two provinces over a two-week period ending July 10.
Since the emergence of the Omicron variant in late November 2021, there have been two periods of significant excess mortality observed so far. Nationally, there were significantly more deaths than expected from the beginning of January 2022 to the end of February 2022. During this period of excess mortality, the highest number of deaths and the highest weekly rate of excess mortality of the pandemic were recorded in the third week of January 2022: over one in five deaths during this week would not have been expected had there been no pandemic. In the spring, excess deaths were observed from the middle of April 2022 to the middle of June 2022. While the first period of excess mortality in 2022 was driven by excess mortality in Quebec and Ontario, the most recent period of excess mortality was driven by excess mortality in the three westernmost provinces. In fact, Alberta and British Columbia had higher than expected weekly deaths through much of 2022.
In essence, they are saying that “the observed Excess Deaths can be from anything but vaccines”, instead of saying that “the observed Excess Deaths can be from anything including the vaccines”. Don’t you find it strange?… (Question to those who still believe everything they say about vaccines)
Great article