How the Government of Canada is manipulating their own data to claim that "vaccines significantly reduce COVID-19 cases", when the data shows the opposite.
This evidence alone suggests that the Government of Canada cannot be trusted with anything it tells us about the vaccines and a public inquiry of the government’s actions is warranted.
Prepared: 16 December 2022. Updated: 6 February 2023.
This article is written so that it can be used by the National Citizens’ Inquiry (NCI) and others in the courts, as needed.
Short introductory video (1 min):
It shows basic steps how to compute the number of cases per week from the cumulative number of cases that are reported by PHAC.
Longer video - with reference to Vaccination Data (3 mins):
It shows the dates when Canada started administering additional doses. It was more than a year after PHAC started counting the Covid cases.
The Question:
How much are Covid vaccines helping reduce the number of Covid infections and Covid deaths? (“The Question”).
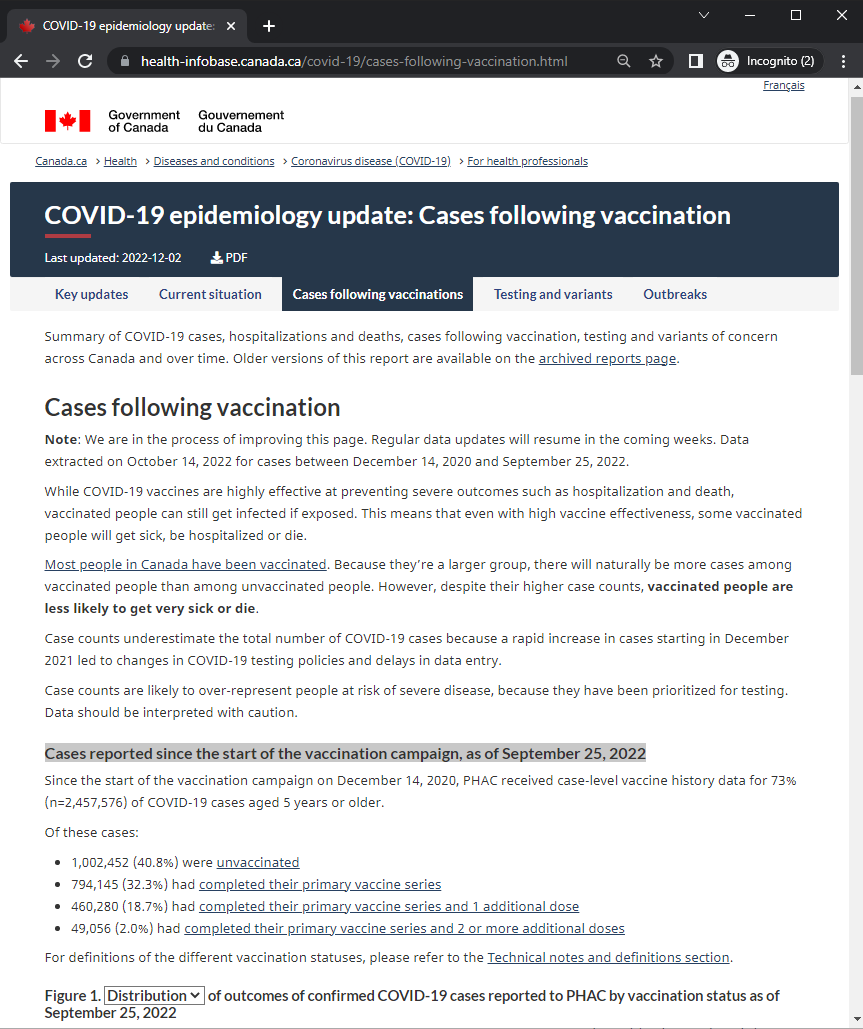
If you were to Google seeking this information, say by typing ‘cases following vaccination Canada’, one of the first links would lead you to the official data published by Public Health Agency of Canada (PHAC): COVID-19 epidemiology update at https://health-infobase.canada.ca/covid-19/cases-following-vaccination.html, which looks something like this:

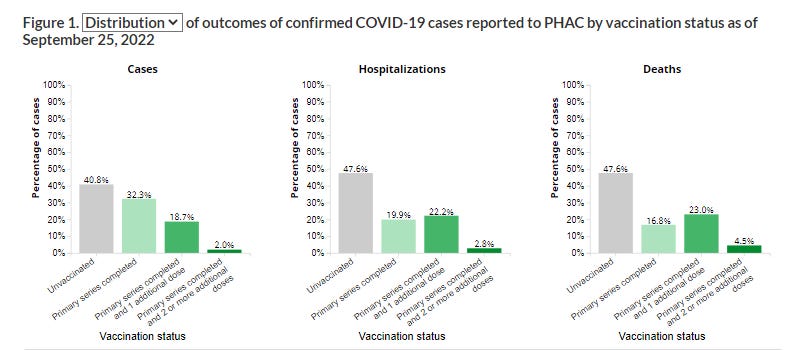
Scroll down to Figure 1 and you will see graphs figure like the one immediately below choosing “Distribution” of outcomes of confirmed COVID-19 cases:
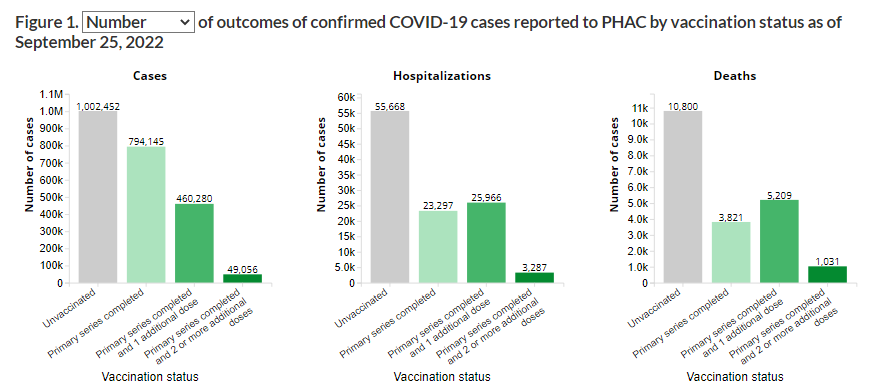
… or like the one immediately below choosing “Number” of outcomes of confirmed COVID-19 cases:
You may think that this is the answer to The Question. You may conclude by looking at these graphs that the more shots you have, the less likely you are to be hospitalized or die. You would be wrong. In fact, the data presented properly demonstrates that the answer is virtually the opposite of what is shown in the Government of Canada’s official PHAC reports - in other words, the more shots you have, the more likely you are to get hospitalized or die. Let’s get into it with some more detail.
Geometric illusions:
The images above are published by PHAC in their ‘Cases following vaccination’ reports ostensibly to “help” you to see the difference in the number of Covid cases - in populations with zero doses, two doses, three doses and four doses. (Note that PHAC does not show the numbers for population with one dose. We will return to this lack of important information and its implications later).
These images show that the number of Covid cases, including hospitalization and deaths, is considerably less among people with 4 doses than among unvaccinated as well as for people with fewer doses compared to the unvaccinated.
You may think that this is the answer to The Question . - You see that the number of Covid cases, including hospitalization and deaths, is considerably less among people with 4 doses than among unvaccinated and people with less doses.
However you would be wrong!
Clearly, this is what PHAC would like you to see and believe, but it is not true. It is a slight of hand they have used.
To further explain, you will note (as shown highlighted in the web-page screenshot above), these published numbers are counts of all cases since the start of the vaccination campaign more than two years ago (December 14, 2020), the overwhelming majority of which, as we know, happened well before Canada started administering third and fourth doses (see image below).
This is like comparing the number of people who believe in Jesus Christ and those who don’t, running polls going back to 1,000 BC.
So, in order to find out how many cases in all populations are actually happening monthly or weekly, you need to go to an older versions of this report, the link to which is also provided on the top of the main page of PHAC’s website (https://health-infobase.canada.ca/covid-19/archive/), find there the report that was published a few months ago (for example, this one: Archived Report for 2022-07-01), and then subtract the numbers that were published in the two reports.
Let’s walk through how we did that.
Computation:
If you look at both reports (the latest one published on December 2, 2022 and the one published on July 1, 2022) together, you will see the following (Note: In order to see the tables shown under the figures, you need to choose “Text description” from the drop down menu below the charts):

Accordingly, in order to know how many cases, hospitalizations and deaths were recorded in that 3 month period, ie between two dates, you need to simply subtract the number of cases as of June 12, 2022 published in one report (2) from the numbers of cases as of September 25, 2022 published in the other report (1) to obtain the numbers of cases that occurred in between June 12, 2022 and September 25, 2022 (3), as shown below:
The resulting numbers (3) can then be visualized using the bar plot as shown at bottom right in red for the number of COVID-19 Deaths that have been recorded between June 12, 2022 and September 25, 2022 (4).
Voila! This is the answer you are looking for, and it is very different from one shown by PHAC.
The red bar plot on the right is very different from the green bar plot on the left published by PHAC. It shows that between June 12, 2022 and September 25, 2022, there were 789 deaths among people with 4 doses, which is almost twice as many as deaths among unvaccinated (431), whereas the PHAC plot (in green) shows 1031 versus 10,800, as if there were ten (10) less deaths among people with 4 doses than among the unvaccinated.
Now you know the answer to your question and also how the Canadian Government handles the statistics so that to it fits its own political messaging.
Evidence: What PHAC’s ‘Cases following vaccination’ data shows
The ‘Cases following vaccination’ data published by PHAC proves two facts:
#1: Post-marketing data does not support claims about vaccine efficacy.
Data published by PHAC reveal that people with 4 doses had more Covid cases (including deaths) than unvaccinated, not less, as shown in PHAC reports.
#2: Data also proves that Government of Canada has been deliberately manipulating the statistics presentation so as to mislead Canadians about vaccine efficacy.
Data published by PHAC also show that PHAC has been deliberately publishing their data in such a way as to mislead Canadians into believing that Covid vaccines considerably reduce the number of Covid cases, , hospitalization and death, whereas in reality the data shows that they do not. In fact, for the period from June 12, 2022 to September 25, 2022, examined here, the data showed the opposite!
By extending the presented analysis to all published reports (as done in Appendix below), one will be able to prove that PHAC has been publishing the misleading information about the vaccine efficacy from the very beginning, i.e., from its very first “Cases following vaccination” reports published in August 2021 and still continues to do so.
Remaining questions and Next steps
Now you know the rest of the story… You know now how the Canadian Government misinformed Canadians about the post-marketing data that was made available following the general public vaccination in Summer 2021 and what happened after that. The government used these - deliberately skewed - data graphs and tables as “scientific evidence” to convince Canadians that vaccines are effective and the only way to stop COVID, and to justify the mandatory vaccination policies that followed thereafter.
Two questions remain:
How to held the Canadian Government accountable for spreading the misinformation about Covid vaccine efficacy observed from its own post-marketing data?
Where else did the Canadian Government intentionally mislead the public about Covid vaccine efficacy and safety?
It is clear that, if the Canadian Government has violated the key principles of scientific and ethical integrity in presenting its own data once - by skewing the data in a very simple post-marketing ‘cases following vaccination’ data reporting exercise - then it is more likely than not that it has done the same, or tried to do the same, elsewhere - with other data too. Equally, it is evident that the Canadian Government will deny any wrongdoing on its part and will try to hinder any investigation related to the dissemination of true information, making it very difficult for the Canadian public to find to what extent and on which other occasions it has done it.
This is why National Citizens’ Inquiry (NCI) has been launched - to demand accountability of the Canadian Government for its actions during the pandemic.
This is also why we have launched this OpenCanada.info newsletter and developed the Open Canada Vital/Vaccine Statistics Tracker (Web App) that is now hosted on the www.OpenCanada.info portal.
Additionally, a special folder is now created in the OpenCanada.info newsletter, called “List of evidences”, where we put together the evidence that can be used by NCI and in the courts. Check it out! This folder is being continuously updated, but a lot of evidence is already included there.
Appendix: Additional technical details and analysis
Results are even worse than shown, when recomputed relative to population size
It is also important to recall that during the examined period, i.e. between June 12 and September 25, 2022, there were more unvaccinated people than people with four doses (see image below).

This means that the difference in the number of cases between unvaccinated and vaccinated with four doses is even higher, than what is visualized above in red bar plot (4), should these numbers be reported relative to the population size (e.g. per 100,000 in each population).
Expending the analysis periods prior to June 12, 2022
One can perform the same analysis (subtraction of the numbers in consecutive reports) for all ‘Cases following vaccination” weekly reports that PHAC produced since its very first such report published on August 10, 2021.
If you don’t have time to do it, we have done it for you in this Googlesheet: https://docs.google.com/spreadsheets/d/1CXkNAOSLoRlr6bZb0NJ46hT4FYHaKSB6MkUJG3lMbbk
This is what you will see there:
The percentage of “fully-vaccinated” vaccinated among COVID cases - as published by PHAC:
Note: This percentage goes up only: from 1.2% in July 2021 (published in the first report), to 37.6% in June 2022 (the last report in its original format, when PHAC was still reporting data for partially-vaccinated people). It is understood why this is the case. - This is because, as the effect of cases counted before vaccination dissipates with time.
The percentage of “fully-vaccinated” among COVID cases - as actually occurring during the weeks for which PHAC were producing the reports:
Note: Compared to image above, this percentage shows much higher proportion of cases among fully vaccinated. This percentage was never small, even and also went up, eventually bypassing the percentage of fully people in Canada (marked by black solid line).
Data from July 17, 2021 till June 05, 2022 (published in its original format, when PHAC was still reporting data for partially-vaccinated people) - relative to population size:
Note 1: Fully-vaccinated have never had significantly fewer number of Covid deaths compared to unvaccinated and partially-vaccinated populations.
Note 2: Starting from January 2022, fully-vaccinated had more Covid deaths than unvaccinated and partially-vaccinated populations.
Data since June 12, 2022 (published in new format, when PHAC was no longer reporting data for partially-vaccinated people and started publishing the date for people with 3 and 4 doses):
Note 1: PHAC stopped publishing cases for people with 1 dose, who, according the data collected prior to June 222 (shown in image above), had the smallest number of cases relative to population size.
Note 2: The number of Covid deaths among 4-dose vaccinated population is considerably larger than that of unvaccinated, which is exactly the opposite of what the PHAC reports were showing.
Note 3: The populations wit more boosters, have consistently more Covid cases than populations with fewer boosters.
Please follow OpenCanada.info on Twitter and share around.


Are you in contact with Allan MacRae of Alberta and Denis Rancourt?
Excellent analysis, thank you. Friendly reminder, according to gov of Canada, "Covid" is a CATEGORY of deaths in people with (mostly) incidental "positive" PCRs. Any end of life people, who had to go to hospital frequently, had to take the "tests." Regardless of many "negatives", one "positive' will then count as a "Covid" death, if this person died (eg. heart failure). These are the unvaccinated "cases" and deaths." One also has to wonder if PHAC added in deaths from jabbed people who died after one dose as "unvaccinated." The bottom line is all-cause mortality analysis shows us what actually happened in Canada. Thanks to Dr. Rancourt's report, there was no pandemic in Canada in 2020. The Expose claims that based on OECD data, Canada has significant excess mortality since the roll-out of these jabs. My point is this category of "Covid" cases and deaths has no clinical significance as it is predicated solely on unvalidated PCR assays with high Cts.